
The Athlete
Drug Abuse
Epidemiology of Alcohol Consumption
PATTERNS OF ALCOHOL CONSUMPTION
Global Consumption
It is difficult to get accurate, comparable, and consistent alcohol use data in other countries but as Table 5-5 points out, most European countries have higher per capita alcohol consumption rates than the United States while most Asian countries have lower per capita consumption. These differences result from a combination of physiological, cultural, social, religious, and legal factors.
Culture is one of the determinants of how a person drinks. Different drinking patterns are found in the so-called wet and dry drinking cultures in Europe. A wet drinking culture (e.g., Austria, Belgium, France, Italy, and Switzerland) sanction daily or almost daily use and integrate social drinking into everyday life. For example, in France children are served watered-down wine at the dinner table (Vaillant, 1995). France also has Europe's second highest per capita consumption of alcohol and second highest death rate from cirrhosis of the liver than any other European nation.
Dry drinking cultures (e.g., Denmark, Finland, Norway, and Sweden) restrict the availability of alcohol and tax it more heavily. Wet cultures consume more wine and beer, 5 times the amount of wine drunk in dry cultures. Dry cultures consume more distilled spirits, almost 1.5 times the amount in wet cultures, and are characterized by binge-style drinking, particularly by males on weekends (Eurocare, 1999). Countries like Canada, England, Ireland, the United States, Wales, and Germany exhibit combinations of wet and dry or mixed drinking cultures where patterns such as binge drinking in social situations are common. A relatively higher incidence of violence against women is found in mixed drinking cultures than in dry or wet cultures, probably because binge drinking often occurs in social situations.
Chinese families generally don't drink much because of cultural pressures. However in Japan and South Korea, social pressures to drink are very powerful. In Japan most of the men and half the women drink, yet their alcoholism rate is half of that in the United States.
In Russia vodka is traditionally drunk between meals in large quantities. Alcoholism had become so rampant in Russia that in 1985, Premier Mikhail Gorbachev severely restricted the availability of alcohol, almost to the point of prohibition. Illegal stills and the consumption of anything with alcohol in it, such as shoe polish and insecticides, soared (Segal, 1990; Davis, 1994). Many of those restrictions have since been lifted. Currently 9% of Russian men and 35% of Russian women abstain from alcohol while 10% of the men and 2% of the women drink several times a week (Bobak, 1999).
In England a trip to the pub for warm beer and darts is a tradition, so 70% of Britons drink regularly. In a recent campaign to stem alcoholism, Britons were urged to reduce their average daily consumption to three drinks a day.
In the United States, a land of many different cultures and lifestyles and a mixed drinking culture, a variety of culturally influenced drinking customs are present. However, much drinking is done away from the lunch and dinner table.
Table 5-5. Worldwide Per Capita Use of Aalcohol vs. Incidence of Chronic Liver Disease |
||
Alcohol in Liters of Pure Ethanol |
Cirrhosis Rate/100,000 |
|
| Russian Federation | 14.0 liters/person/year (1992) |
15 |
| France | 12.6 liters/person/year (1996) |
18 |
| Germany | 11.8 liters/person/year (1996) |
23 |
| Ireland | 11.2 liters/person/year (1994) |
2 |
| Spain | 9.3 liters/person/year (1996) |
20 |
| Greece | 8.7 liters/person/year (1996) |
8 |
| Italy | 8.1 liters/person/year (1996) |
21 |
| United States | 8.1 liters/person/year (1995) |
10 |
| United Kingdom | 7.6 liters/person/year (1996) |
9 |
| Japan | 6.8 liters/person/year (1996) |
-- |
| Canada | 6.4 liters/person/year (1996) |
-- |
| Poland | 6.2 liters/person/year (1996) |
12 |
| Mexico | 3.4 liters/person/year (1996) |
-- |
| Israel | 2.0 liters/person/year (1996) |
10 |
| Algeria | 0.4 liters/person/year (1996) |
-- |
| (Harkin, 1995; Eurocare, 1999) | ||
POPULATION SUBGROUPS
Men
In all age groups men drink more per drinking episode than women do, regardless of country. Much of this difference has to do with the cultural acceptability of male drinking and the disapproval of female drinking in almost every country. The other reason for the difference reflects the ability of men to be able to more efficiently metabolize higher amounts of alcohol. Unfortunately men also have more adverse consequences and develop problems with alcohol abuse or alcohol dependence (alcoholism) at a higher rate than women.
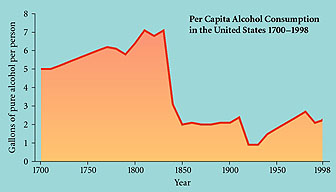
Figure 5-8. In the United States the per capita consumption of pure alcohol at present is 2.2 gallons but as this chart shows, the rate has varied wildly with the rise and fall of prohibition movements, health concerns, and availability of a good water supply. Adapted from David F. Musto's Alcohol in American History, Scientific American, April 1996
Women
For women alcohol problems become greater in their 30s, not in their 20s as for men (Blume, 1997). Alcohol-dependent women as a group drinkabout 1/3 less alcohol than alcohol-dependent men (York, 1990).
Negative health consequences develop faster for women than for men. Proportionally, more women than men die from cirrhosis of the liver, circulatory disorders, suicide, and accidents. As mentioned female alcoholics have a 50-100% higher death rate than male alcoholics. But just as health problems develop after sustained heavy drinking, health disorders, especially reproductive problems, and depression may precede heavy drinking and even contribute to it. Also women get higher BAC from the same amount of alcohol drunk than men and therefore have greater toxic effects from the same level of alcohol ingestion.
In terms of treatment, studies show that society has a double standard that more readily accepts the alcoholic male but disdains the alcoholic female. Thus women are less likely to seek treatment for alcoholism than men but are quicker to utilize mental health services when, in fact, their real problem is alcohol or other drugs. Women are also more likely to be driven to treatment when their physical or mental health is suffering whereas men are more likely to seek treatment when they have problems with their employment or with the law (Gomberg, 1991; Ross, 1989).
Table 5-7. Women and Alcohol Problems |
|
More Likely to Have Drinking Problems |
Less Likely to Have Drinking Problems |
Younger women Never married |
Older women (60+) Multiple roles (married, stable, work outside the home) Married Widowed Children in the home Black women Hispanic women Nondrinking spouse |
| (NIDA, 1994) | |
Alcohol, Students, & Learning
It used to be that only college students, away from the control of their parents, began heavy drinking. But in the late 1980s and '90s, the age of first use and heavy use dropped to where many students had done it all by the time they finished their senior year in high school. The problem is that since so much maturing and developing takes place during high school and college years, drinking can negatively affect learning and maturation.
"Often it's the style of drinking, not experimentation, that gets college students (as well as high school kids and young adults) in trouble. Many think the name of the game is to get drunk. They drink too fast, they drink without eating, they play drinking games or contests, or they binge drink. They drink heavily and hard on "hump day" [Wednesday] or over the weekend. But because they drink heavily only once or twice a week, they think that there is no problem. But there usually is a problem: lower grades, disciplinary action, or behavior they regret, which usually means sexual behavior. And both males and females talk to me about having been drunk and regretting the person they were with or their conduct with that person."
Forty-four percent of college students admit to binge drinking at least once every two weeks (Wechsler et al., 2000). Binge drinking is defined as having five or more drinks at one sitting for males, four for females. About half the students in one study who admitted to binge drinking also admitted that their grades fell in the C to F range as opposed to the A to C range of most students. Many binge drinkers missed classes on a regular basis. In a national study there was a startling, dramatic, and direct correlation between the number of drinks consumedper week and the grade point average.
Notice that women's grades start to deteriorate at slightly less than half the level it takes for men's marks to go down. The National Household Survey on Drugs 1998 (Fig. 5-9) indicates that the higher the level of educational attainment, the more likely was the current use (not necessarily abuse) of alcohol. This seems a contradiction with the statistics about grade performance; however, the rate of heavy alcohol use in the 18-34 age group among those who had not completed high school was twice that of those who had completed college. In general, college students learn to moderate their drinking before they graduate.
Table 5-8. Average Number of Drinks Per Week, Listed by Grade Average |
|||
| Grade Average | Drinks Per Week |
||
Males |
Females |
Overall |
|
| A | 5.4 |
2.3 |
3.3 |
| B | 7.4 |
3.4 |
5.0 |
| C | 9.2 |
4.1 |
6.6 |
| D or F | 14.6 |
5.2 |
10.1 |
| (College Core Study of 56 four-year and 22 two-year colleges by Southern Illinois University - Carbondale, 1993) | |||
Older Americans
"I visited my granddad in the retirement center/nursing home when he was 93 years old. He showed me the medicine cabinet. It was a small closet that, when opened by a nurse, revealed dozens of bottles of alcohol-whiskey, rum, scotch, vodka, and a variety of wines-each one with the name of one of the elderly residents. Depending on the health of the patient, they could have one or two drinks a day for their health. The tension and heart attack relief seemed to work quite as well as a sedative-hypnotic. He was still healthy at 96 when a fall killed him."
Doting 42-year-old grandson
People who are 65 years or older constitute the fastest growing segment of the U.S. population. About 6% to 21% of elderly hospital patients, 20% of elderly psychiatric patients, and 14% of elderly emergency room patients exhibit symptoms of alcoholism (AMA, 1996). One study indicates that approximately 2.5 million older adults have alcohol-related problems (Schonfeld & Dupree, 1991).
Research indicates that patterns of drinking persist into old age and that the amount and frequency of drinking are a result of general trends in society rather than the aging process. Hip fractures, one of the most debilitating injuries that occurs to the elderly, increase with alcohol consumption mainly due to decrease in bone density because of the deleterious effects of alcohol (Adams, Yuan, Barboriak, et al., 1993). In nursing homes as many as 49% of the patients have drinking problems although some nursing homes are used as a place to hospitalize problem drinkers, so the rate may seem higher than the general population (Joseph, 1997). Another problem is that the average American over 65 years old takes two to seven prescription medications daily and so alcohol-prescription drug interactions are quite common (Korrapati & Vestal, 1995).
About 1/3 of elderly alcohol abusers are of the late onset variety. Some older people may increase their drinking because of isolation, retirement, more leisure time, financial pressures, depression over health, loss of friends or a spouse, lack of a day-to-day structure, or simply the availability and access to alcohol in the home or at friends' homes. This increased drinking can lead to abuse and addiction problems. The elderly alcohol abuser is less likely to be in contact with the workplace, the criminal justice system, or treatment providers than those experiencing more visible mainstream problems. Thus it may be more difficult to identify elderly abusers and get them help.
One of the reasons diagnosis of drug or alcohol problems is difficult in the elderly is the coexistence of other physical or mental problems that become much more prevalent due to the aging process. Dementia, depression, hypertension, arrhythmia, psychosis, and panic disorder are just some of the conditions whose symptoms are mimicked either by drug use or withdrawal from drug use (Gambert, 1997).
However even with all the reasons and pressures to drink, people 65 and older have the lowest prevalence of problem drinking and alcoholism. There are several reasons for the lower rates.
- People who become alcohol abusers or alcoholics usually do so before the age of 65, suggesting a high degree of self-correction or spontaneous remission with age.
- Cutting down on drinking or giving up drinking may be related to the relatively high cost of alcohol for those on a fixed income, as well as to adverse health consequences or to the fear of adverse health consequences.
- The body is less able to handle alcohol since liver function declines with age. The general aging process also decreases tolerance and slows metabolism, so the older drinker often has to limit intake.
- Since effects are increased if someone is ill or is taking medications, more severe side effects and greater toxic effects encourage drinkers to cut back as they age.
Homeless
For various reasons, some obvious, some not, it is hard to estimate the number of homeless in the United States. Varied sources suggest figures from 500,000 to 2 million with the average length of homelessness of 6 months. The breakdown of the homeless population is
- 46% are single males,
- 14% are single women,
- 36.5% are female heads of household with children,
- 25% are children.
Minorities are overrepresented:
- 56% are African American,
- 29% are Caucasian,
- 2% are Native Americans,
- 1% are Asians.
Finally it is estimated that
- 8% have HIV or AIDS (1/3 of prostitutes who are homeless have HIV or AIDS [Wallace, 1989]),
- 23% could be considered mentally ill,
- and a staggering 45% have serious substance abuse problems. (U. S. Conference of Mayors, 1995)
Street young adult: "We wake up and we drink."
Street teenager #1: "Drink a beer."
Street teenager #1: "And we go to sleep right after we're done drinking at night. But we drink all day long, every day, all the time, constantly."
Street teenager #2: "Except for right now 'cause we don't have enough money for a beer."
Counselor: "How long have you been doing that?"
Street young adult: "All my life, pretty much since I was a teenager."
Counselor: "How old are you now?"
Street young adult: "Twenty eight . . . and I've been living like this since I was 13. I take breaks. I'll get a job and shit but then I still drink then too. Don't get me wrong. I have money for beer even if I have to pawn stuff."
Interview with street people by a counselor from the Haight-Ashbury Clinic Youth Outreach Program

Figure 5-9. This chart compares the use and abuse of alcohol vs. the level of education. SAMHSA, 1999
The reasons for homelessness vary widely. There are
- the situationally homeless who, because of job loss, spousal abuse, poverty, or eviction, find
- the street people who have made the streets their home and have made an adjustment to living outside;
- the chronic mentally ill who have been squeezed out of inpatient mental facilities in the last three decades in favor of less costly out-patient health facilities for treating their conditions;
- the homeless substance abusers, particularly alcohol abusers, whose lives center around their addiction that has made them incapable of living within the boundaries of normal society.
Within the last two groups are seen the mentally ill person who has begun to use drugs (often to self-medicate) and the drug user/abuser who has developed mental/emotional problems as a result of drug use. One of the keys to all these groups is to understand their lack of affiliation with
any kind of support system. Services to identify and treat substance abuse or mental problems are hard to come by or shunned by the homeless person (Joseph & Paone, 1997).
A comprehensive program to alleviate the drug and mental problems of the homeless usually involves outreach that will bring services to the clients and eventually bring the clients to where the services are located. Many cities try to locate services at shelters and gathering places for the homeless but since a wide variety of services are needed to meet the wide variety of problems, budget constraints often become the deciding factor.
MINORITY POPULATIONS
Biological and neurochemical differences between different ethnic groups account for some of the different patterns of alcohol and drug use in different communities. However, diverse cultural traditions represented by ethnic minorities seem to make a greater contribution to alcohol use and abuse patterns as do the degree of assimilation into the drinking patterns of the dominant culture. Sensitivity to ethnic traditions and degrees of assimilation can help us understand how alcohol use affects the health, family life, and social interactions of various cultures and in turn, can contribute to more effective treatment and prevention. Generally a family history of alcoholism in both first- and second-generation relatives varies among ethnic groups in the United States.
African American Community
In the 1998 Household Drug and Alcohol Survey as in previous years, heavy use of alcohol was lower among African Americans than among Caucasians or Hispanics
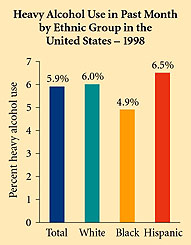
Figure 5-10. In the United States during 1998, Caucasians continued to have a high rate of heavy alcohol use (5 or more drinks 5 or more times in the past month) at 6.0%. Rates for Hispanics were 6.5% and for African Americans, 4.9%. SAMHSA, 1999
(4.9% vs. 6.0%) (Fig. 5-10). Use on a monthly basis in Black men is also less than White men (49% vs. 61%). The same patterns hold for use by Black women vs. White women (32% monthly use vs. 50%) (SAMHSA, 1998). On the other hand even though more Black women abstain than White women, there is greater heavy drinking among those Black women who do drink. Peak drinking for Blacks occurred after the age of 30 whereas drinking among Whites peaked at a younger age. Two reasons for the higher rate of abstention and the lower rate of heavy drinking among African Americans is their long history of spirituality, along with a strong matriarchal family structure, both of which look down upon heavy drinking.
One disturbing fact is that medical problems brought on by heavy drinking among African Americans are more severe (Caetano & Clark, 1998). This is probably due to less access to health care facilities, insurance programs, and prevention programs as well as a delayed entrance into treatment for alcoholism as compared to Whites (John, Brown, & Primm, 1997).
Hispanics
In 1999 there were 32 million Hispanics in the United States or about 11.6% of the total population (U.S. Bureau of the Census, 1999). One of the problems with examining Hispanic alcohol or drug use is the diversity of cultures involved: Mexican American, Cuban American, Puerto Rican, Colombian American, and a dozen other Spanish-speaking countries.n addition a single culture consists of anywhere from first- to tenth-generation immigrant Americans. About 60% of all Hispanics in the United States are of Mexican origin; 15% of the total are of Puerto Rican origin; and 5% are of Cuban origin (U.S. Bureau of the Census, 1999). The remaining 20% are from a variety of Latin countries. In a survey done in the early '80s, heavy alcohol use was highest in the Mexican American community, somewhat lower in the Puerto Rican community, and very low in the Cuban American community.
Table 5-10. Alcohol Use by Hispanic Communities, 1998 |
||||||
Lifetime |
Past Year |
Past Month |
Past Week |
Heavy |
%Reporting Dependence |
|
| Total | 70.8% |
58.56% |
45.4% |
15.6% |
6.5% |
7.0% |
| Hispanic Males | 80.4% |
68.3% |
56.8% |
24.8% |
||
| Hispanic Females | 60.8% |
48.4% |
33.6% |
6.1% |
||
| (SAMHSA, 1998) | ||||||
Drinking in the Hispanic community increases with both sexes as education and income increase. One of the problems with alcohol abuse and addiction in the Hispanic community is a lack of culturally relevant treatment facilities and personnel. Part of the severity of the problem has to do with the disruption of the family unit and the degree of assimilation.
"I think the cultural differences are crucial. To give you an example, I was in detox once and this woman came in, an Hispanic woman, and she was being interviewed by another counselor, and she was in an abusive relationship and the other counselor told her that she would have to leave her relationship if she wanted to stay clean. And I thought, 'this woman's going to bolt. She's not going to leave her family.' And I had to intervene in a delicate way because otherwise I felt we were going to lose her."
35-year-old female Hispanic drug counselor
The rate of alcohol use among female Hispanics has grown over the last 20 years possibly due to the different attitude towards women's rights, more female heads of household, or because of different cultural traditions. Generally women still drink considerably less than men. In treatment a strong involvement of the family is necessary plus an appreciation of the values of dignidad, respeto, y cariño (dignity, respect, and love) (Ruiz & Langrod, 1997).
Table 5-9. History of Alcoholism in Family |
|
| American Indians and Alaska Natives | 48% |
| Caucasians | 23% |
| African Americans | 22% |
| Hispanics of Hispanic Origin | 25% |
| Non-Hispanics of Hispanic Origin | 23% |
| (NCADI, 1999) | |
Asian Americans & Pacific Islanders (API)
Asian Americans and Pacific Islanders (APIs) are the fastest growing ethnic minority in the United States and currently make up about four percent of the total population, approximately 11 million people. However because the label API encompasses dozens of distinct ethnicities throughout the Pacific basin, including Japanese, Chinese, Filipino, Korean, Vietnamese, Thai, Indonesian, Burmese, and Pacific Islanders, the diversity of Asian cultures is much greater than the differences between European cultures.
Asian Americans and Pacific Islanders are reported to have the lowest rate of drinking and drug problems in the United States. However as the APIs became more highly acculterated (more generations in America and increased ease with English), drinking increased (Zane & Kim, 1994). There are genetic factors that may help deter heavy drinking among APIs. The other major influence seems to be cultural (i.e., heavy drinking is strongly disapproved of in most API cultures). Surveys confirm that there are significant differences in drinking patterns among different national API groups (Johnson & Nagoshi, 1990). (Note that there are sometimes large differences between Asian and Asian American drinking patterns for the same country-the foreign-born vs. American-born Asians of the same ethnic origin and even among the same generation of Asian Americans in with identical ethnicities (Westermeyer, 1997).
In one study in Los Angeles (Table 5-11), Filipino Americans and Japanese Americans were twice as likely to be heavy drinkers as Chinese Americans but Chinese Americans were less likely to be abstainers. The Korean Americans have the highest number of abstainers. In general, Asian American males under 45 who are educated and in the middle class are most likely to drink but there is relatively little problem drinking even among this group (Makimoto, 1998).
As with other ethnic groups, treatment is much more effective when it is culturally relevant. For example, in San Francisco at the Haight-Ashbury Clinic, relatively few APIs came in for treatment, often because of the stigma involved in admitting that there was a problem. When research was done on the
drug use patterns of the API communities in San Francisco, when more API counselors were hired, and when a specific treatment facility for Asian Americans was created, the API population in treatment vastly increased.
Table 5-11. Drinking Patterns of 1,100 Los Angeles Asian Americans |
|||
| Group Drinking | Heavy Drinking |
Moderate Drinking |
Abstaining |
| Japanese Americans | 25% |
42% |
33% |
| Chinese Americans | 11% |
48% |
41% |
| Korean Americans | 14% |
24% |
62% |
| Filipino Americans | 20% |
29% |
51% |
| (NIAAA, 1991) | |||
American Indians & Alaskan Natives
There are approximately 2.4 million American Indians and Alaskan Natives in the United States (U.S. Bureau of the Census, 1999). They are divided into more than 300 tribal or language groups. Stereotypes and old western movies seem to have influenced much of the thinking about Native Americans and drinking. The picture of the "Indian who can't hold his liquor" has been perpetuated for generations. One explanation is that although the rate of abstinence is quite high in many tribes, it is the pattern of heavy binge drinking among males in various tribes, especially on reservations, that accounts for the highly visible Native American alcoholic. (However in a survey of Sioux tribes, the women drank as much as the men.) The fact that many surveys are done on reservations where only 1/3 of the total Native American population lives, coupled with the grinding poverty found on many of those tribal reservations, is also a strong causative factor in heavy drinking (Beauvais, 1998).
Historically Native Americans only drank weak beers or other fermented beverages but usually just for ceremonial purposes. When distilled alcoholic beverages were introduced, most Native American cultures did not have time to develop ethical, legal, and social customs to handle the stronger drinks. A study of a group of Native Americans (Mission Indians) studied the inherited sensitivity to alcohol and found that they were not more sensitive to the effects of alcohol. Rather they were less sensitive and so had to drink more to get drunk (a sign of susceptibility to developing alcoholism) (Garcia-Andrade, Wall, & Ehlers, 1997).
Generally the abuse of alcohol accounts for 5 of the leading 10 causes of death in most tribes. Alcohol-related motor vehicle deaths are 5.5 times higher than for the rest of the U.S. population. Cirrhosis of the liver is 4.5 times higher; alcoholism, 3.8 times higher; homicide, 2.8 times higher; and suicide, 2.3 times higher. Although Native American women drink less than men, they are especially vulnerable to cirrhosis and account for almost half of the deaths from cirrhosis (Manson, Shore, Baron, et al., 1992).
In general, drinking patterns vary widely among the more than 300 tribes of Native American and Alaskan peoples who make up about 1% of the population of the United States. Some tribes are mostly abstinent; some drink moderately with few problems; and some have high rates of heavy drinking and alcoholism. One study in Oklahoma found alcohol-related causes of death varied from less than 1% up to 24% among the 11 tribes surveyed, compared with 2% for Blacks and 3% for Whites (Manson et al., 1992).
Information on Drug Abuse:
Information on Alcohol:
Epidemiology of Alcohol Consumption